Observability is often understood as technical capability to expose critical indicators (i.e. the internal state) of a system/application. While this is one side of the story, Digital Architects Zurich strongly believe that there is an additional key benefit of Observability: shifting responsibility for application stability and reliability to developers (i.e. shift-left). But let’s take one step at a time!
What is Observability?
The first concept of Observability appeared in 1960 by the engineer Rudolf E. Kalman, but it wasn’t until 2010 that we discovered the importance of observability in the IT field and its role into the business growth.
In a nutshell, Observability is the capability to ask arbitrary questions about your system without knowing them in advance. The goal is to explain what is happening inside your system when observing it from the outside (see What is Observability, Splunk). Therefore, Observability is all about equipping a system with tools designed to collect, persist, analyse and visualise data.
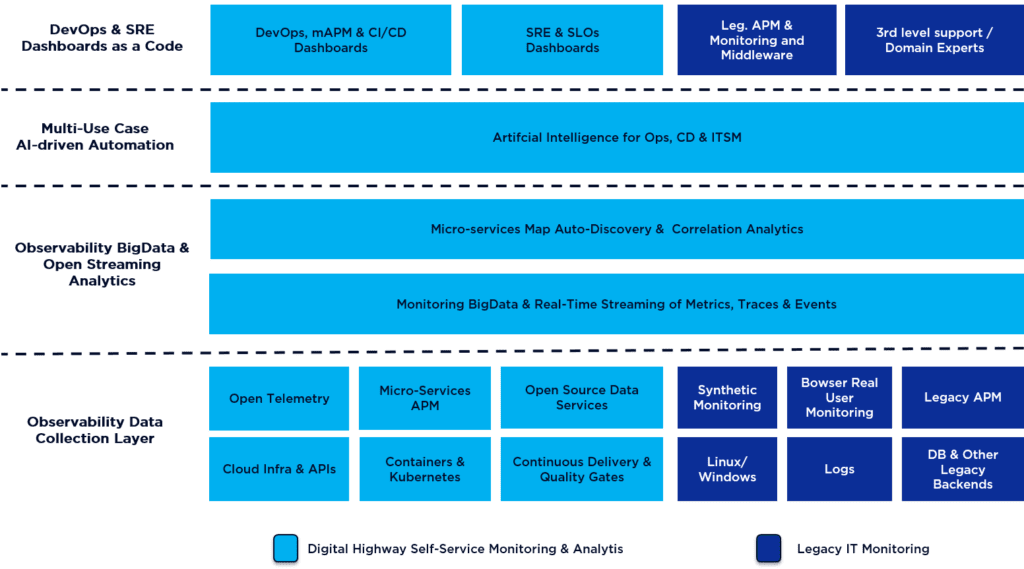
There are some key criteria that need to apply to such an Observability stack, the following list provides a (not complete) overview:
- Non-proprietary data source support (i.e. 3rd party data sources instead of proprietary agent data only)
- Ability to ingest data from APIs, especially also cloud sources
- Leverage streaming to achieve real-time processing
- “as Code” for various aspects of the system: Dashboards as Code, Automation as Code, Correlation as Code, Monitoring Configuration as Code
- Open and domain-agnostic Machine Learning engine (see Gartner, Market Guide for AIOps Platforms, 2021)
We have introduced some of these key Observability patterns in a previous blog post (see Digital Architects Zurich, Effective SRE Tooling for Self-service Monitoring and Analytics) and visualised these critical requirements when selecting a tool stack for implementing Observability in our “Open Observability-based Instrumentation & AI-able Streaming Architecture Blueprint” (OOBASA):
We will dive into further technical aspects like the kind of required data in a later chapter, first let us review the operating model impact that Observability brings.
Adopting Observability is about Tooling and Shift-Left of Responsibility
For Digital Architects Zurich, Observability is not only a technical implementation, but also a practice which requires a change in operating model and culture. Developers are the people who know their code and application best which is why they should be the primary adopter of Observability, thereby shifting responsibility to the left side of the application delivery lifecycle (this is called shift-left).
Examples of how this shift-left in responsibility is done:
- Definition of critical use cases and supporting SLOs is done at the beginning of application development, often by product owners or business requestors.
- Specification of the critical SLIs is done by developers, including implementation of Observability code within the application (for more details on what SLIs are, see Effective SRE: SLO Engineering and Error Budget)
- Code for dashboards visualising SLI/SLO is managed by developers alongside the SLI specification
By addressing these practices to earlier in the application development cycle, Observability also supports moving responsibility for system’s reliability to developers or site reliability engineers (SRE). To achieve this successfully, a change in culture is needed, because people need to understand the benefits of Observability and live the required values. We have documented this in a previous blog post on Effective SRE (see Effective SRE: How to Democratize and Apply SRE in Your Organisation).
Key Data Types for Observability: Metrics, Events, Logs and Traces (MELT)
The acronym MELT stands for Metrics, Events, Logs and Traces which form the four essential data types or “pillars” of Observability (also see New Relic, Telemetry Data 101).
- Metrics: are numeric measurements (i.e. numerical timeseries) with a timestamp that provide information about a process or activity. Examples: CPU usage, error rate over a specific time interval
- Events: are actions happening at a time, for example a deployment of a component
- Logs: discrete (i.e. non aggregated) text data from a system, the immutable record of discrete events that happened over time. There are several types of logs:
- Plaintext
- Binary
- Structured
- Traces: In a microservice world with numerous calls between services, distributed tracing helps to understand the connection between components and how requests flow through these services, thus allow to establish the chain of events.
Leveraging these four data types, Observability and subsequently visibility is established for systems and applications.
OpenTelemetry as Standard for Observability
To successfully implement Observability, you need a way to collect and process the metrics that are emitted by the applications. This is the “Data Collection” layer in the OOBASA blueprint. The most common standard for Observability and MELT is OpenTelemetry (see What is Opentelemetry, Opentelemetry.io).
Before 2019, there were various major projects that had this in mind: OpenCensus from Google as well as OpenTracing and OpenMetrics from CNC. In 2019, they decided to join forces and form a new open-source initiative under the name of OpenTelemetry. As soon as this was clarified, all the major contributors to any of the previous projects jumped in and OpenTelemetry has seen a lot of activity over the past years.
OpenTelemetry is a collection of tools APIs and SDKs used to instrument, generate, collect and export telemetry data (MELT).
There are two key components of the OpenTelemetry architecture and specification:
- The OpenTelemetry or OTEL Collector
- The OpenTelemetry Instrumentation Libraries
The OTEL Collector is a vendor agnostic component that is either run as agent to collect metrics or it is run as gateway to forward and bundle metrics it receives.

Source: https://opentelemetry.io/docs/
The second component are the instrumentation libraries available for many different programming languages and either provide an automatic or manual way to extract signal data from applications and forward it to the OTEL collector for further processing.
Many monitoring and Observability providers have joined the OpenTelemetry project, are contributing to it or support OpenTelemetry as data source. For example, Splunk is a major contributor to OpenTelemetry (see What is OpenTelemetry, Splunk) and released their unified Splunk Observability Suite with capabilities to ingest signal data from applications and infrastructure and add their value on top of that by providing additional functionality to agents and instrumentation libraries. We have done a Webinar about this last year, you can watch the replay here: Leveraging OpenTelemetry with Splunk Observability.
Why is Observability important? What are the benefits of Observability?
We have seen that Observability provides the capability to detect issues affecting customers faster by observing the right indicators (MELT) in real-time, thereby making it easier to resolve issues rapidly and pinpoint root causes faster.
In addition, Observability supports the practice of Site Reliability Engineering (SRE) by shifting left the responsibility for reliability aspects of applications and services.
According to Helen Beal, chief ambassador of DevOps Institute, embracing observability supports SREs goals by (see Helen Beal, The Key Benefits of Observability for SREs):
- Reducing the toil associated with incident management—particularly around cause analysis—improving uptime and MTTR.
- Providing a platform for inspecting and adapting according to SLOs and ultimately improving teams’ ability to meet them.
- Offering a potential solution to improve when SLOs are not met, and error budgets are overspent.
- Relieving team cognitive load when dealing with vast amounts of data–reducing burnout.
- Releasing humans and teams from toil while improving productivity, innovation and the flow and delivery of value.
- Supporting multifunctional, autonomous teams and the ‘We build it, we own it,’ DevOps mantra.
- Completing the value stream cycle by providing insights around value outcomes that can be fed back into the innovation phase.”
Get in Touch to Learn More
Please let us know if you have comments or would like to understand how Digital Architects Zurich can help you adopt Observability. We also provide training and engineering power for your team to effectively set-up Site Reliability Engineering (SRE), Continuous Delivery pipelines and AI-driven Continuous Verification.
References
- Helen Beal, The Key Benefits of Observability for SREs, https://devops.com/the-key-benefits-of-observability-for-sres/
- Peter Bourgon, Metrics, tracing and logging, https://peter.bourgon.org/blog/2017/02/21/metrics-tracing-and-logging.html
- Digital Architects Zurich, Effective SRE Tooling for Self-service Monitoring and Analytics, https://wpwithkarim.com/effective-sre-tooling-for-self-service-monitoring-and-analytics/
- Digital Architects Zurich, Effective SRE: SLO Engineering and Error Budget, https://wpwithkarim.com/effective-sre-slo-engineering-and-error-budget/
- Digital Architects Zurich, Leveraging Open Telemetry (Webinar), https://wpwithkarim.com/webinar-leveraging-opentelemetry-with-splunk-observability/
- Digital Architects Zurich, Effective SRE: How to Democratize and Apply Site Reliability Engineering in Your Organisation, https://wpwithkarim.com/effective-sre-how-to-democratize-and-apply-site-reliability-engineering-in-your-organisation/
- Gartner, Market Guide for AIOps Platforms, 2021, https://www.gartner.com/en/documents/4000217
- Gartner, 3 Top Priorities to Optimize Your Investments in Application Performance Monitoring Tools, 2021, splunk.com/en_us/form/gartner-three-top-priorities-to-optiimize-you-investments-apm.html
- Honeycomb.io, Learning about Observability, https://docs.honeycomb.io/getting-started/learning-about-observability/
- New Relic, Telemetry Data 101, https://newrelic.com/platform/telemetry-data-101
- OpenTelemetry.io, What is OpenTelemetry?, https://opentelemetry.io/docs/concepts/what-is-opentelemetry/
- Firas Sozan, The need for SRE observability, https://www.harrisonclarke.com/devops-sre-recruiting-blog/the-need-for-sre-observability
- Splunk, What is Observability, https://www.splunk.com/en_us/data-insider/what-is-observability.html
- Splunk, What is OpenTelemetry, https://www.splunk.com/en_us/data-insider/what-is-opentelemetry.html