An open Observability-based instrumentation & AI-able streaming architecture to pilot the Digital Highway
We introduced, in a previous blogpost, the high-level pattern of the digital highway suggested by Digital Architects Zurich to tackle the following challenge:
“Ensuring SLOs in the age of digital transformation, Cloud & DevOps while keeping budget under control and leveraging value-add Cloud-Native and AI-Driven technologies & best practices”
In the introductive blogpost, we defined the digital highway as a central infrastructure in the digital operating model: “the digital highway aims for reliable and continuous software delivery and operations! ”. Then, in our last blog, we presented the Effective SRE approach that aims to pilot the digital highway at the heart of the effective SRE implementation practices.
In this one, we will try to tackle the design and implementation strategies we recommend setting up, and the Effective SRE tooling required to pilot the digital highway.
Before starting the walkthrough, let us visualize what we are talking about when we mention the digital highway:
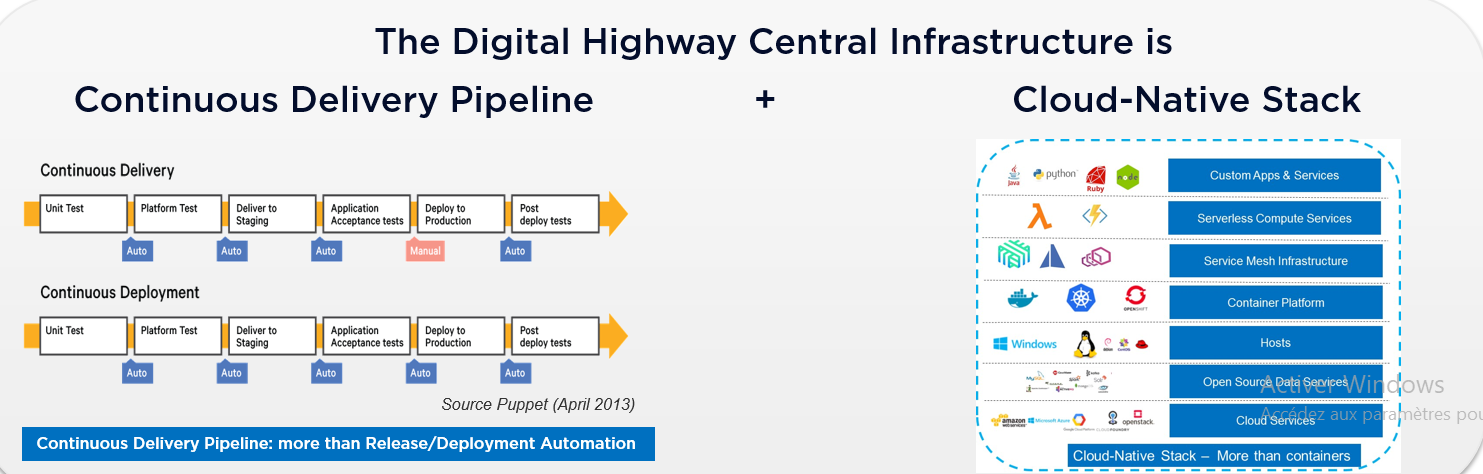
An architecture approach to design the SRE Tooling for Piloting the digital highway
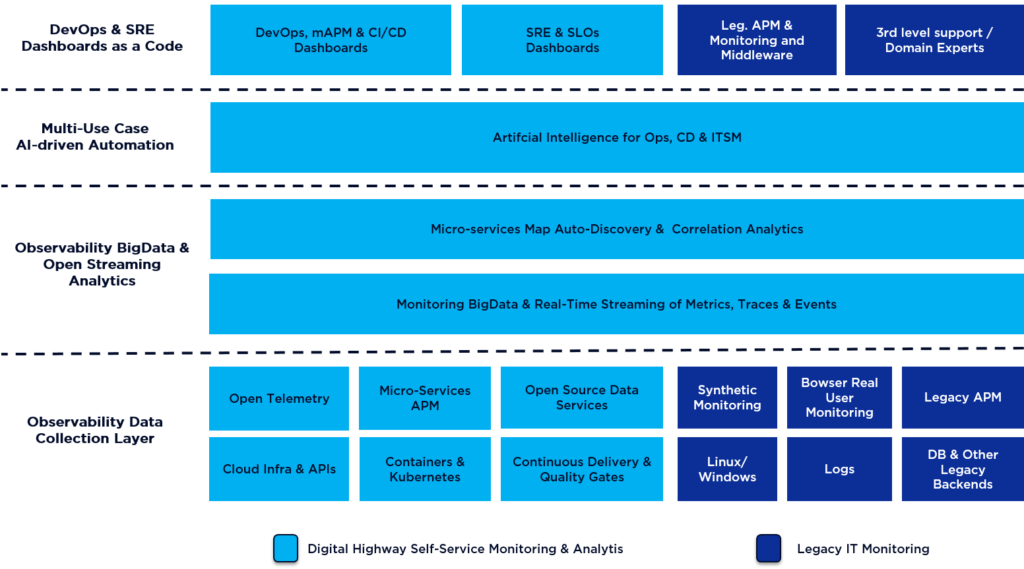
The starting point of our approach is the following proven systems management and software architecture model we have seen working in large enterprise environments for more than two decades.

This proven 4-layer architecture model has been successfully adopted by different systems management and control disciplines throughout the industry, including modern IT companies.
At the same time, the design patterns and implementation strategies in the IT have drastically evolved to tackle the constant changes especially in the underlying technology stacks (Mainframe, Unix/Linux, JVM, VM, …) and architectures (monolithic, C/S, JEE, SOA, …).
Digital, DevOps and Cloud Transformation are impacting the four key IT modernisation streams (see Figure 2) with direct effect on the design and implementation of the 4-layer architecture to control and manage complex and critical infrastructure (such as the Digital Highway = CD Pipeline + Cloud-Native Stack).

In the following sections we will walk through the layers. Then we will briefly introduce the design patterns and implementation strategies to tackle the challenges brought to DevOps, Micro-Services, Containers and Cloud.
Design Patterns and Implementation Strategies for the Data Collection Layer: Observability-Centric
The DevOps popular slogan “You build it, you run it” has in fact a major impact in the shared responsibility model related to monitoring and alerting.
According to the Puppet “State of DevOps” report (2018), about 90% of the mature DevOps organisations have empowered DevOps teams towards Configurable Monitoring and Alerting.
Furthermore, the majority of DevOps teams are relying on implementing observability code instead of “external” agents.
After deeply studying these patterns and benchmarking the different solution patterns and implementations in representative environments, we at Digital Architects Zurich, came to the following design patterns and implementation strategies to introduce this Observability-Centric Layer:
- Built-in observability instead of «external» agents.
- OpenTelemetry vs. BCI/APM Agents (see container journal, reference 5).
- Observability: tracing first approach, tracing before I/O intensive logging.
- Observability in the cloud: API first approach.
- Observability for legacy: built-in/low cost first approach.
The design patterns and implementation strategies to feature this Observability-centric Layer can enable Self-Service Monitoring and Alerting for DevOps teams. We may eventually propose a blog post detailing this aspect in particular.
Design Patterns and Implementation Strategies for the Data Integration & Storage: Streaming-able Observability BigData
The DevOps adoption combined with the introduction of high-speed CD pipelines on one hand and the ephemeral and fine granular microservices/Containers on another hand will create the following Observability Data Integration and Storage challenges:
- Explosion in metrics, traces and events volume and format which cannot be designed in advance and handled by a relational DB (i.e. Performance Management Database). Gartner Analysts, in their paper about AIOps Platform, are talking about the «ever increasing volume, variety and velocity of data generated by IT in response to digital transformation» .
- The integration of all this data in different formats (metrics, traces, events, text files, …) from diverse data sources (Cloud APIs, mServices traces, Hosts/Containers metrics, 3rd Party APIs, legacy agents & logs…) is very complex and challenging.
- The «Big» intelligent agent-based approach used by domain-centric AIOps including domain specific performance analytics solutions like APM and NPM is not optimal for DevOps and mServices
- The DIY (Do-it-Yourself) approach based on Open Source frameworks, the preferred approach for DevOps Unicorns and Developers, is however not always optimal for non-high-tech industries due to the highly sophisticated skills required to build, maintain and support (Gartner; Market Guide for AIOps Platform, 2018).
- Batch-based monitoring data analytics are not efficient in this perspective. In fact, you need to run the queries periodically every x minutes which eventually generates a major delay for alerting in high speed and ephemeral environments.
- Tracking the containers and the mService dependencies and reconciling their status based in an ITSM CMDB and on «external» discovery and monitoring agents will not work and scale. Such implementation strategy was already complex and showed its limits in older architectures (C/S, JEE, …) and process models (waterfall with few changes per year).
As Effective SRE tooling, we recommend the following design patterns and implementation strategies to handle the above Observability data integration and analysis/analytics:
- Observability: BigData instead of PMDB
- BigData is recommended as the foundation for any AIOps Platform to integrate and prepare the observability data collected from several data sources (Open Telemetry, Cloud APIs, Legacy Built-in Monitoring, etc…) and expose them to an AI engine for further resp. advanced analytics.
- BigData is recommended as the foundation for any AIOps Platform to integrate and prepare the observability data collected from several data sources (Open Telemetry, Cloud APIs, Legacy Built-in Monitoring, etc…) and expose them to an AI engine for further resp. advanced analytics.
- Supporting multiple data sources: Open Observability BigData or DIY
- As a first choice, we recommend an implementation strategy for the Observability BigData along with the use of open, domain agnostic AIOps components. These usually re-use an open integration for Data Collection (such Open Telemetry, Cloud APIs and open source, etc…) and support the most relevant input data formats (metrics, traces, structured events, unstructured events/text files…).
- DIY is still a valid alternative. However, it requires sophisticated technical skills and a high effort to build, maintain and operate (e.g. storage volume!)
- Observability data ingestion & handling: Streaming instead of Batch Analytics
- Streaming-based analytic is suitable to handle the KEY requirements of alerting or anomaly detection in seconds instead of minutes or hours. Further, streaming analytics allows to start the analysis query once or subscribe it to data points, keep it running and apply correlation and machine learning analytics when new data arrives.
- Service Mesh Discovery instead of CMDB-based Service Discovery & Reconciliation.
- mService topology discovery and tracing is a standard capability offered by Service Mesh infrastructure such as Istio and linkerd and is the recommended approach by Service Architects (see references 2 and 3).
- An open and domain-agnostic AIOps platform with an API-based integration into the most popular Service Mesh implementations is very recommended in order to enrich the Observability-based BigData and provide a Machine Learning-driven basis for the automation layer.
Design Patterns and Implementation Strategies for the Automation Layer: Open Domain agnostic AIops Engine
The DevOps team is responsible for defining the monitoring scope and alerting criteria. Blackbox ML and AI engines were used by legacy performance analytics solutions (such as Netuitive and IBM Predictive Insights) and domain-centric AIOps solutions (such as the ones embedded in APM or NPM technologies), however offer the DevOps and SRE team no or limited capabilities especially when it comes to:
- «Correlation as a code» to detect anomalies & accelerate root cause analysis
- Advanced custom analytics reflecting SLO/SLI dependencies, for instant and multi-variant alerting based on streaming data
- Leverage ML for business, incident, Continuous Delivery and other use cases based on both streaming and historical data
- Instant Triggering of automatic actions via Ops Runbooks or tight integration with CI/CD platforms
As DevOps resp. the SRE teams are designing their microservices resp. SLOs and they best understand the expected behaviour. We recommend the following as design patters and implementation strategy:
- An Open and flexible Machine Learning Engine as key component of a domain agnostic AIOps that comes with many ready-made recipes and algorithms on one hand and allows «customer analytics as a code» on the other hand. This might be the most effective solution approach.
- The DIY (Do-it-Yourself) approach based on Open Source frameworks offers again an alternative for Open ML Capabilities, however is not always optimal for non-high-tech industries (see Gartner paper, reference 4)
Design Patterns and Implementation Strategies for the Presentation Layer: DevOps & SRE Dashboards as Code
The following dashboards are required to support the new roles in their daily job:
- DevOps dashboards include SLO Status, mService maps and quick navigation.
- SRE dashboards include SLOs, incidents, business KPIs and CD dashboards.
- API management dashboards.
- Cloud usage dashboards.
Moreover, these views should be updated in seconds, not in minutes. They need to be programmable in order to enable customization and “monitoring-as-a-code” as required in order to maximize automation, sharing and efficiency in and among DevOps teams. Such dashboarding capabilities happen to be key factors for enabling the recommended adoption by the DevOps Teams, who are the “owners” of their monitoring “as a code”.
Based on our field experience in large enterprises, we strongly recommend to design and implement such dashboard capabilities together with the Observability Integration and Automation layer handled above. Therefore, you should opt for Open and domain agnostic AIOps Platforms with BigData storage and Streaming capabilities or DIY based on open source components.
At Digital Architects Zurich, we have then assembled the above introduced building blocks into the following Open Observability-based Instrumentation & AI-able Streaming Architecture as blueprint for Effective SRE to set-up Self-Service Monitoring and Analytics for the Digital Highway they need to pilot and operate.
Foot notes/References: