Introduction
In a previous blog post, we introduced the key building blocks of Effective SRE (Site Reliability Engineering), which are Observability (often shortened with the numeronym “o11y”), usage of OpenTelemetry and the concept of MELT (Metrics, Events, Logs and Traces). In today’s blog post, we will deep dive into the necessary Key Capabilities for any modern Observability tool, based on our experience working with large and small enterprises.
Observability is an important concept in modern IT and is crucial to managing today’s complexity of solutions, and ultimately a key enabler for the growth of businesses, for Effective SRE and Reliability Engineering. Observability involves the capability to ask arbitrary questions about a system without knowing them in advance to detect unknown unknowns. While observability is often understood as a technical capability to expose critical indicators of a system or an application, Digital Architects Zurich believe, there is an additional benefit: shifting the responsibility for application stability and reliability to developers (shift-left). With easy-to-use interfaces, allowing quick analysis of data across various sources, Observability tools also help to break down silos between different parts of the organization and strengthens the communication between DevOps, Operations and SRE teams by providing a common basis for looking at application and systems.
To create an effective observability stack key criteria that must be met include non-proprietary data source support, the ability to ingest data from APIs and cloud sources, real-time processing (streaming), high scalability, use of machine learning (ML) and artificial intelligence (AI) and addressing all aspects of the system as code. We will dive into all these topics in the next paragraphs.
Overview of Key Capabilities, based on our Observability Benchmark
In our previous Blog Post, we also introduced our Observability Architecture Blueprint, named “Open Observability-based Instrumentation & AI-able Streaming Architecture Blueprint” (OOBASA):
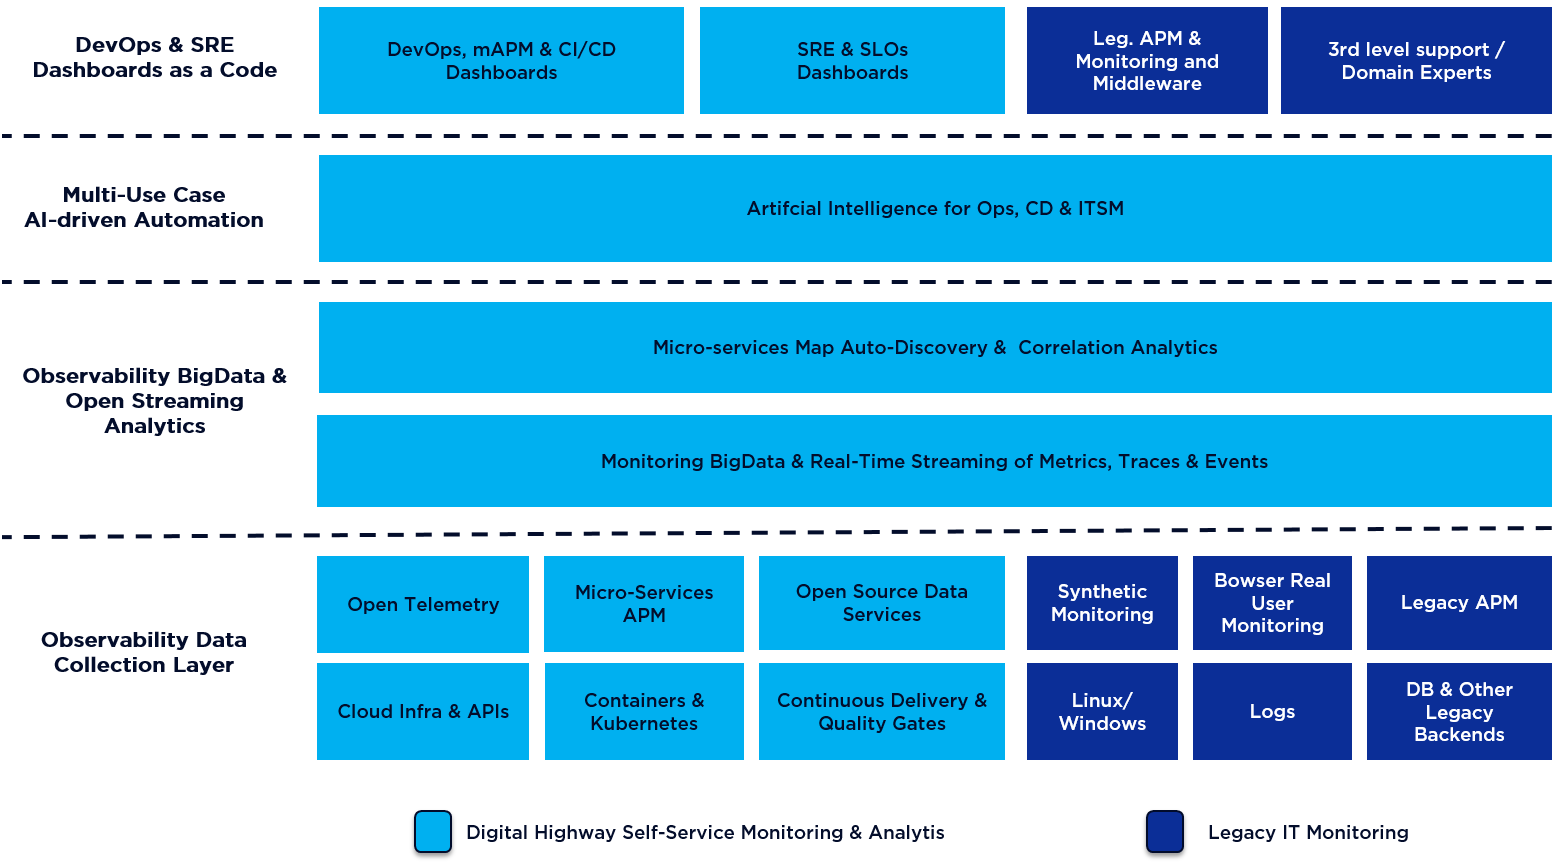
DevOps & SRE Dashboards as Code / Presentation & Visualization
Observability dashboards are important tools for providing real-time visibility into the performance and health of complex systems. For observability dashboards to be effective, they need to be customizable to meet the unique needs of the organization and provide relevant insights. A user-friendly interface is essential to ensure the dashboard is accessible and usable by all organization members. Observability dashboards should provide real-time visualization of the data, enabling teams to detect issues and respond to them quickly. Also, dashboards should provide actionable insights, support collaboration and be scalable to meet the organization’s changing needs. A collection of built-in dashboards can accelerate the on-boarding and offers out-of-the-box insights with one click. A fine-grained role-based access control system is also crucial for collaboration (and sometimes for data segregation). Overall, observability dashboards are critical tools for issue triaging and optimizing complex systems. Obviously, those dashboards need to be deployed / updated / deleted as fast as new releases are deployed / updated / deleted and as such, should be part of a Continuous Delivery pipeline and automated through API, a capability we call “Dashboard as code”.
Multi-Use Case AI-driven Automation
Modern observability tools require multi-use case AI-driven automation to provide real-time insights and predictions based on historical data. This can lead to advanced features such as predictive analytics like predictive maintenance or smart scalability and costs optimization, anomaly detection, data and alert correlation. Customizability and openness of AI algorithms and AI pipelines are crucial for leveraging the power of AI in observability. Production-ready AI is like a subsystem within the main system and as such, also needs its own proper monitoring. This is, where MLOps (Machine Learning Development and Operations) comes into play. MLOps as a key feature of Observability tools enables the monitoring of AI models and helps automate processes like the collection, staging and management of the data, automated training and evaluation of new models and automated comparison of new deployments (with older).
Incorporating AI-powered automation also increases efficiency and productivity, enabling teams to focus on higher-level tasks and proactively address issues. AI can learn from previous incidents and optimize for future scenarios, improving overall system resilience and reducing downtime.
Also take note of the related blog post from Machine Learning Architects Basel on Observability for MLOps
However, it’s essential to note that not every problem can or should be solved by AI, considering the associated high costs and complexity. SLO engineering is an easy-to-use but very powerful toolset with functions that secure and improve reliability and resiliency. SLO engineering and AI-driven automation work hand-in-hand to detect all kinds of issues a system can face. The backbone of Observability is built on SLOs with AI features, where SLO engineering doesn’t perform well.
Observability Big Data & Open Streaming Analytics
Observability tools must be scalable to handle the growth and changes of systems and processes, process large amounts of data in real-time and provide timely insights and alerts. Customizability is essential for meeting the specific needs of different organizations and use cases, including the ability to create custom dashboards, alerts, service maps and data analysis. A cloud-native observability tool is also important for effectively monitoring cloud-based systems and taking advantage of cloud-based storage, processing, and scalability. But an Observability tool should be able to handle hybrid or even on-prem systems. To cope with increasing load / data volume, it should also be highly scalable.
Observability Data Collection Layer
Observability tools must be scalable to handle large amounts of data, process it in real-time, and provide timely insights and alerts to keep pace with the changing needs of organizations. Integration with other tools and systems such as APM (Application Performance Monitoring) and log management is essential for providing a comprehensive view of the systems being monitored. Additionally, security measures must be implemented to protect sensitive data and prevent unauthorized access, ensuring that the observability tool can be used by different users and roles. An Observability tool should have native Open Telemetry (OTel) support, which is an open-source framework supported by almost all major Observability tool providers in the market, making it – DeFacto – a highly interoperable standard.
Key take-aways & Outro
As technology continues to advance and systems grow increasingly complex, the need for effective observability becomes paramount. By embracing the right observability tools, organizations can gain valuable insights into their systems behavior, troubleshoot issues more efficiently, and proactively optimize performance. However, it is crucial to remember that observability is not a one-size-fits-all concept. The comparison of different visions, approaches and key capabilities presented in this blog post can serve as a starting point for organizations to evaluate their requirements and make informed decisions. Ultimately, by leveraging the power of observability tools and adopting a holistic approach to monitoring and debugging, organizations can enhance their operational efficiency and deliver better experiences to their users.
Key Capabilities
- DevOps & SRE Dashboards as Code / Presentation & Visualization
- Multi-Use Case AI-driven Automation
- Observability Big Data & Open Streaming Analytics
- Observability Data Collection Layer
Get in Touch to Learn More
Please let us know if you have comments or would like to understand how Digital Architects Zurich can help you with the adoption of Observability. We support customers not only from a technological perspective during evaluation or roll-out but also provide paths to Observability adoption including operating model, role/team set-up and integration into existing processes through consulting and training.
References
-
Effective SRE Key Capabilities: Observability, OpenTelemetry and MELT, Digital Architects Zurich, 2022
- OpenTelemetry, CNCF, 2023
- Reliability, The backbone of successful businesses, Digital Architects Zurich, 2021
- Effective SRE Tooling for self-service Monitoring and Analytics, Digital Architects Zurich, 2020
- MLOps Journey, Machine Learning Architects Basel
- Observability for MLOps, Machine Learning Architects Basel, 2022